Press
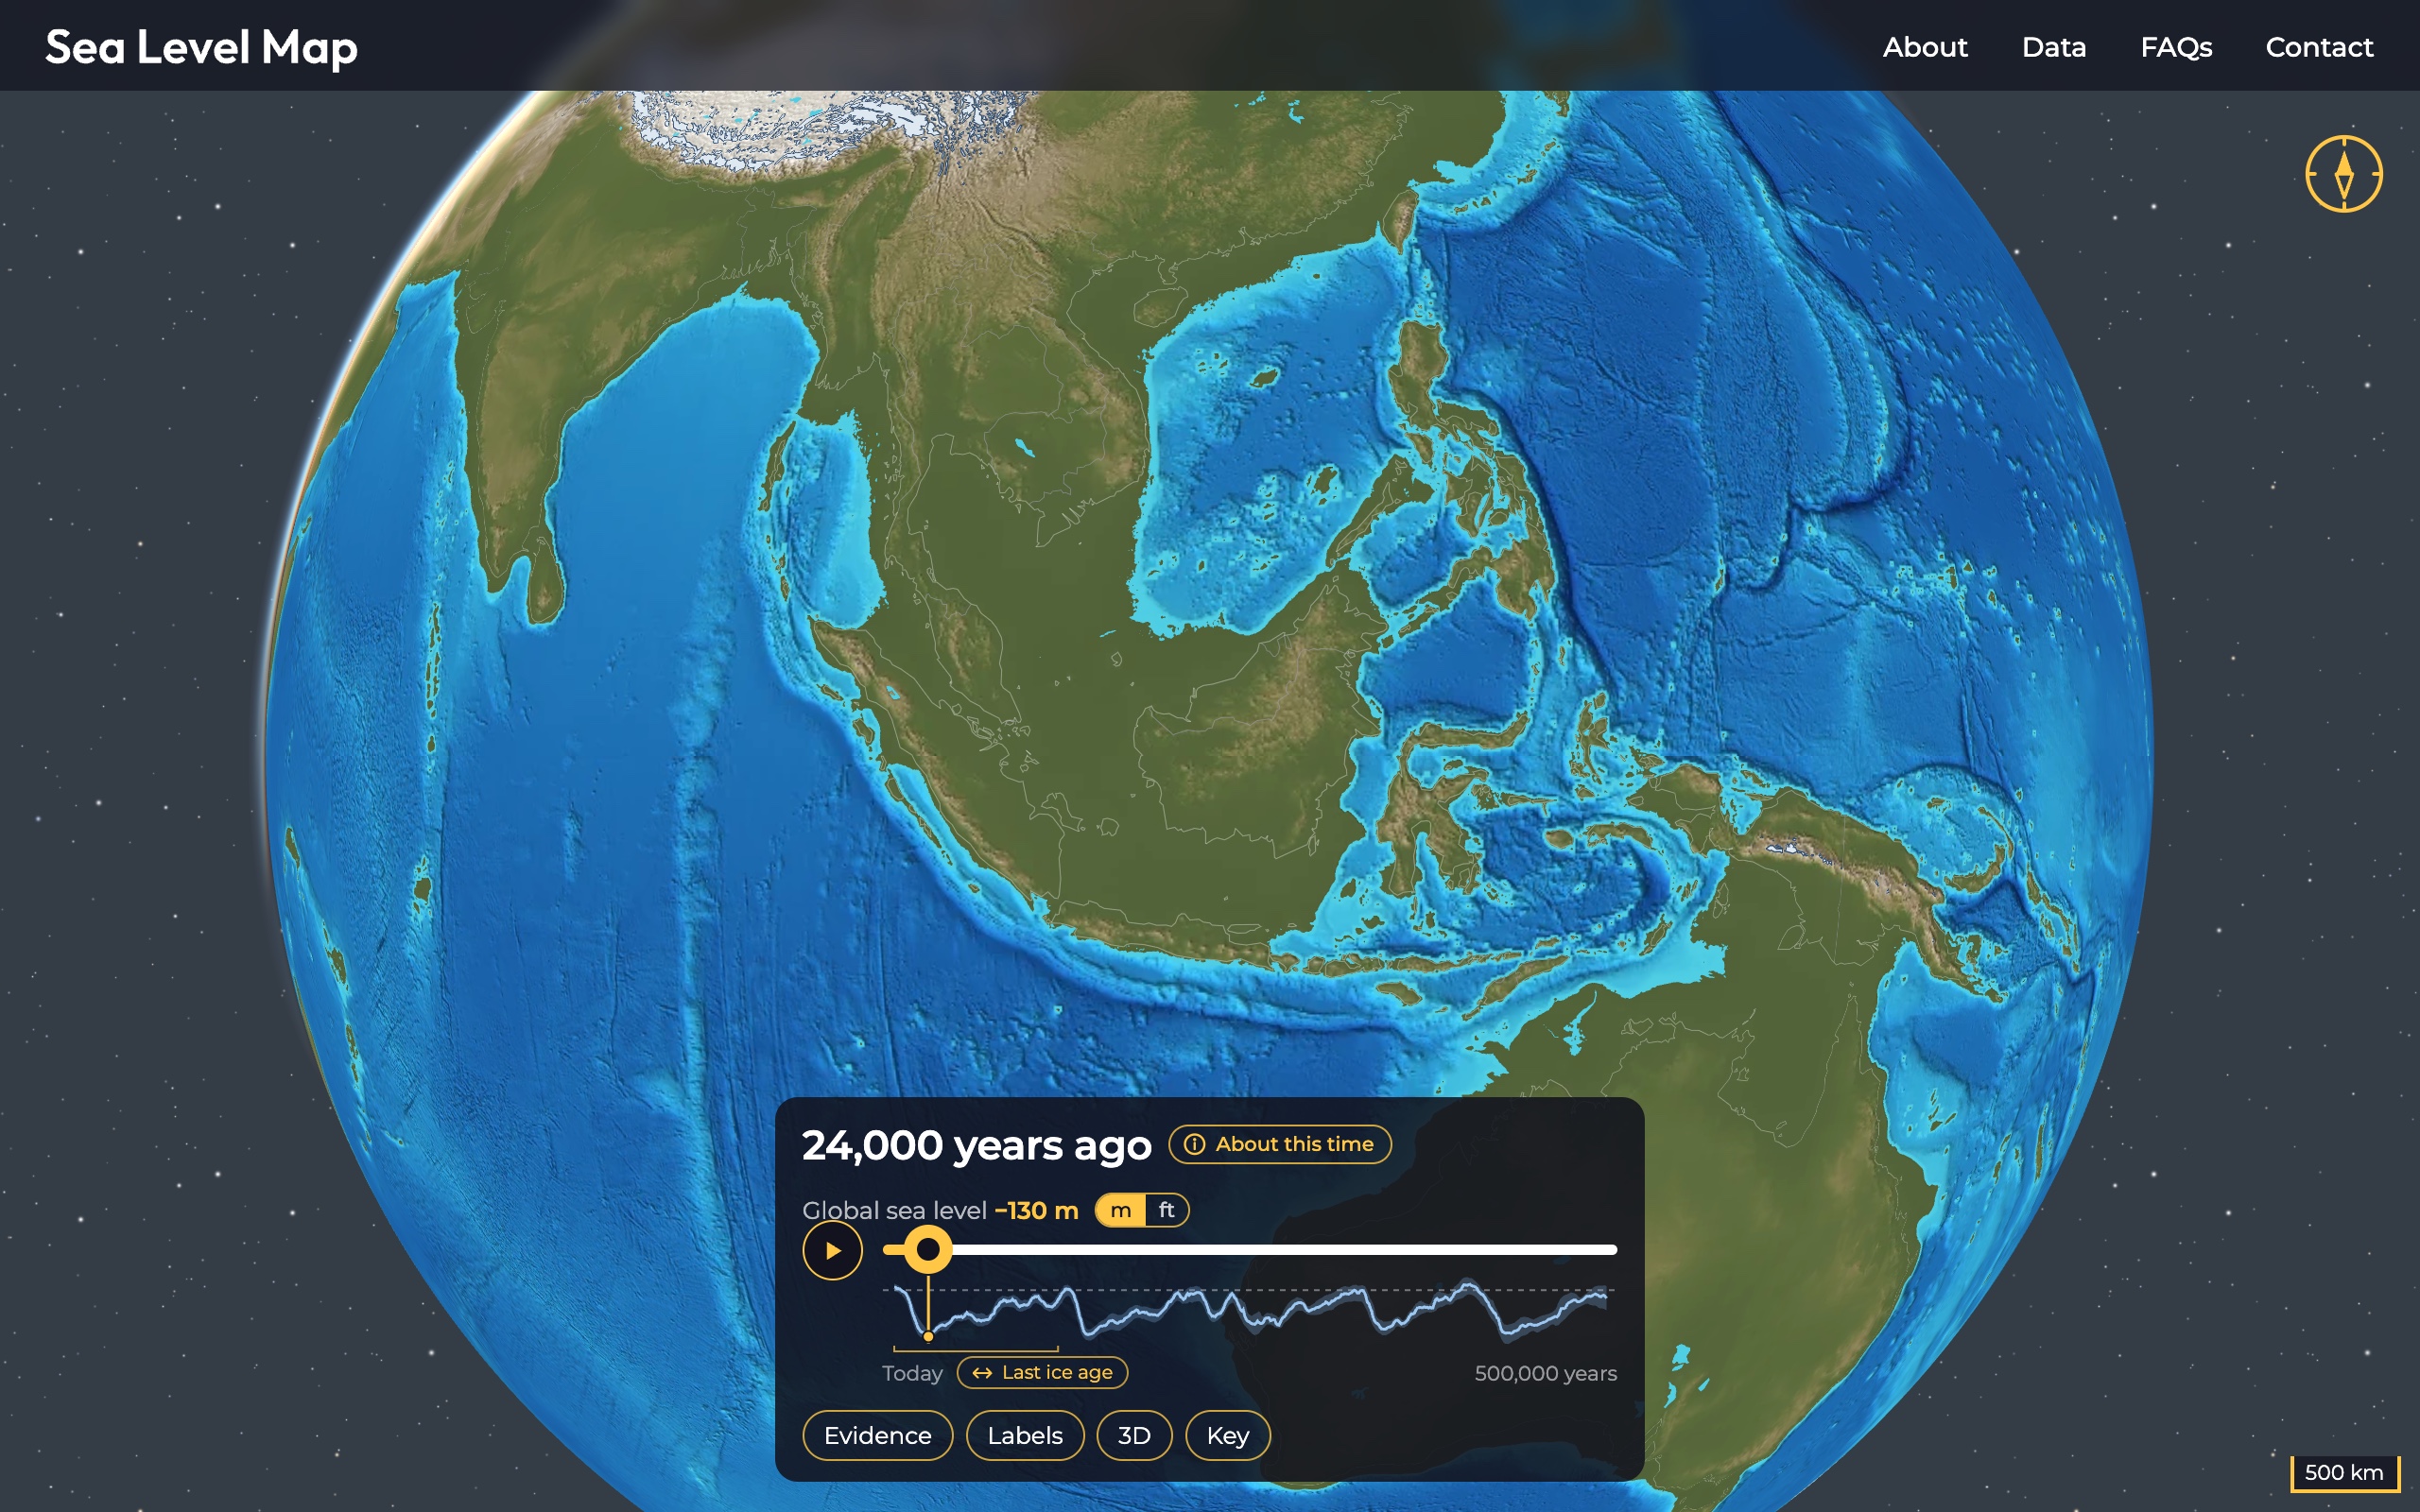
SeaLevelMap.io is a free interactive globe of the world's coastlines and ice sheets over the past 500,000 years, from today back through five ice age cycles.
Key facts
- Covers 500,000 years in 101 time steps, from today back to Marine Isotope Stage 13.
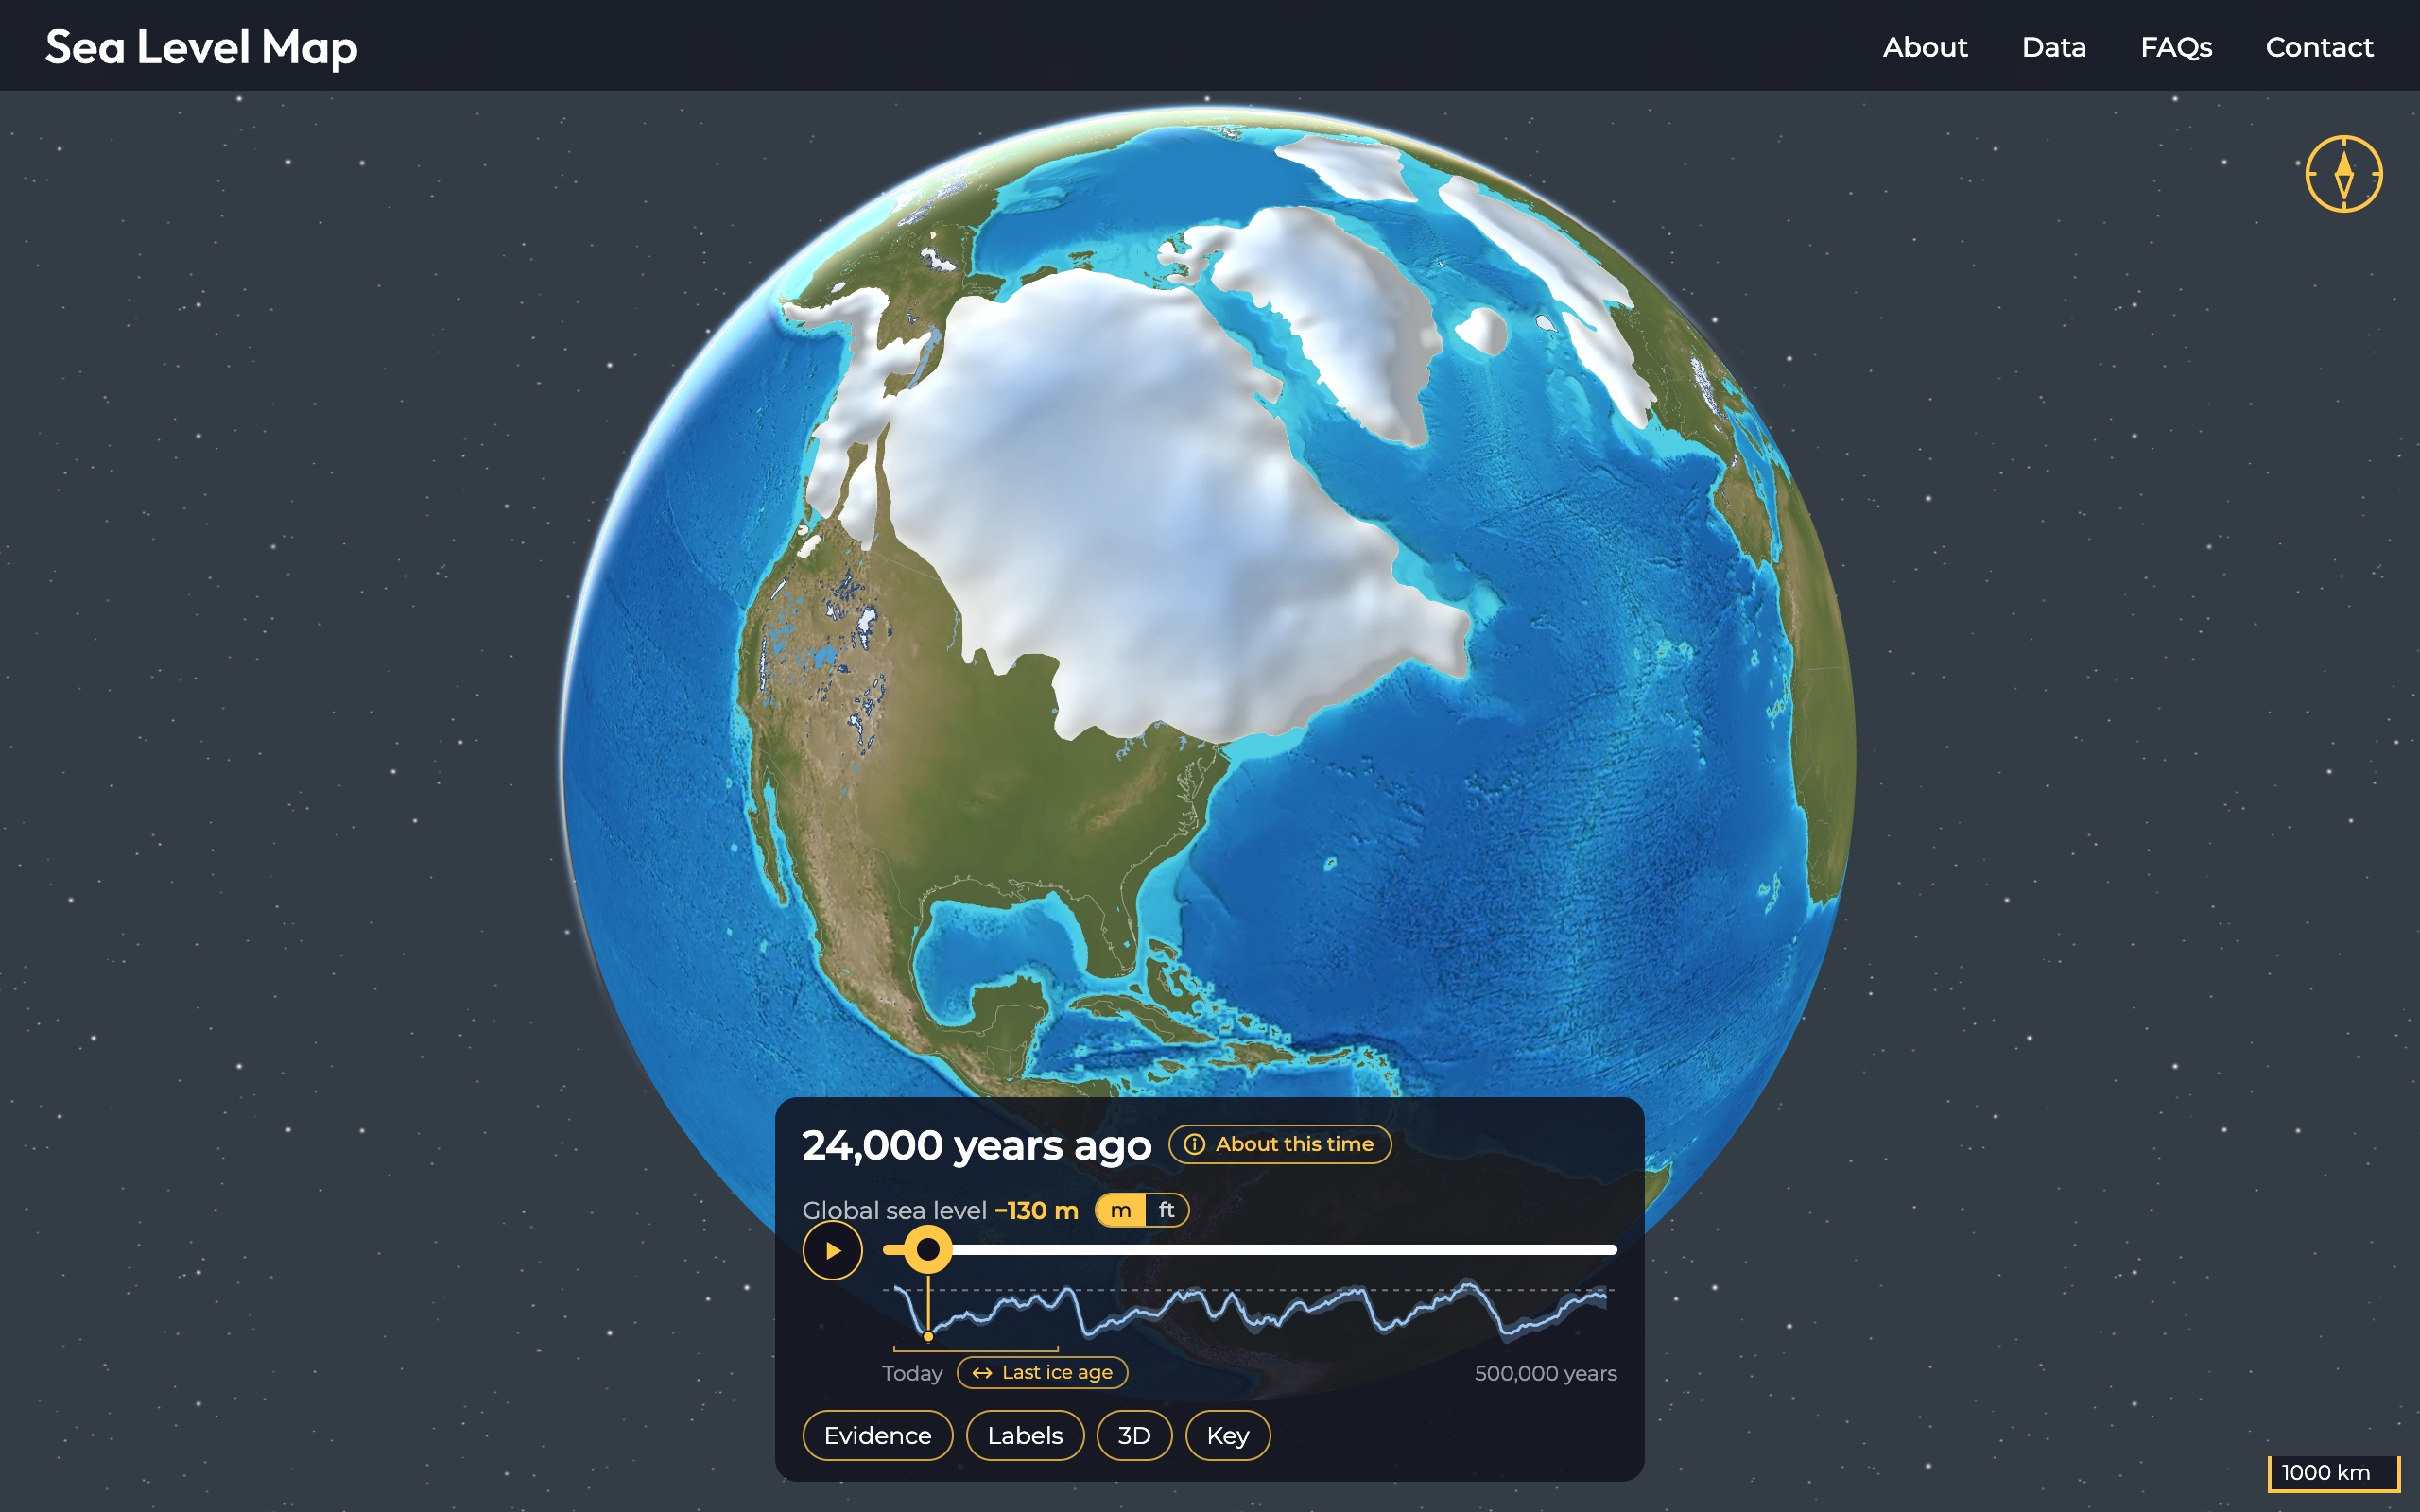
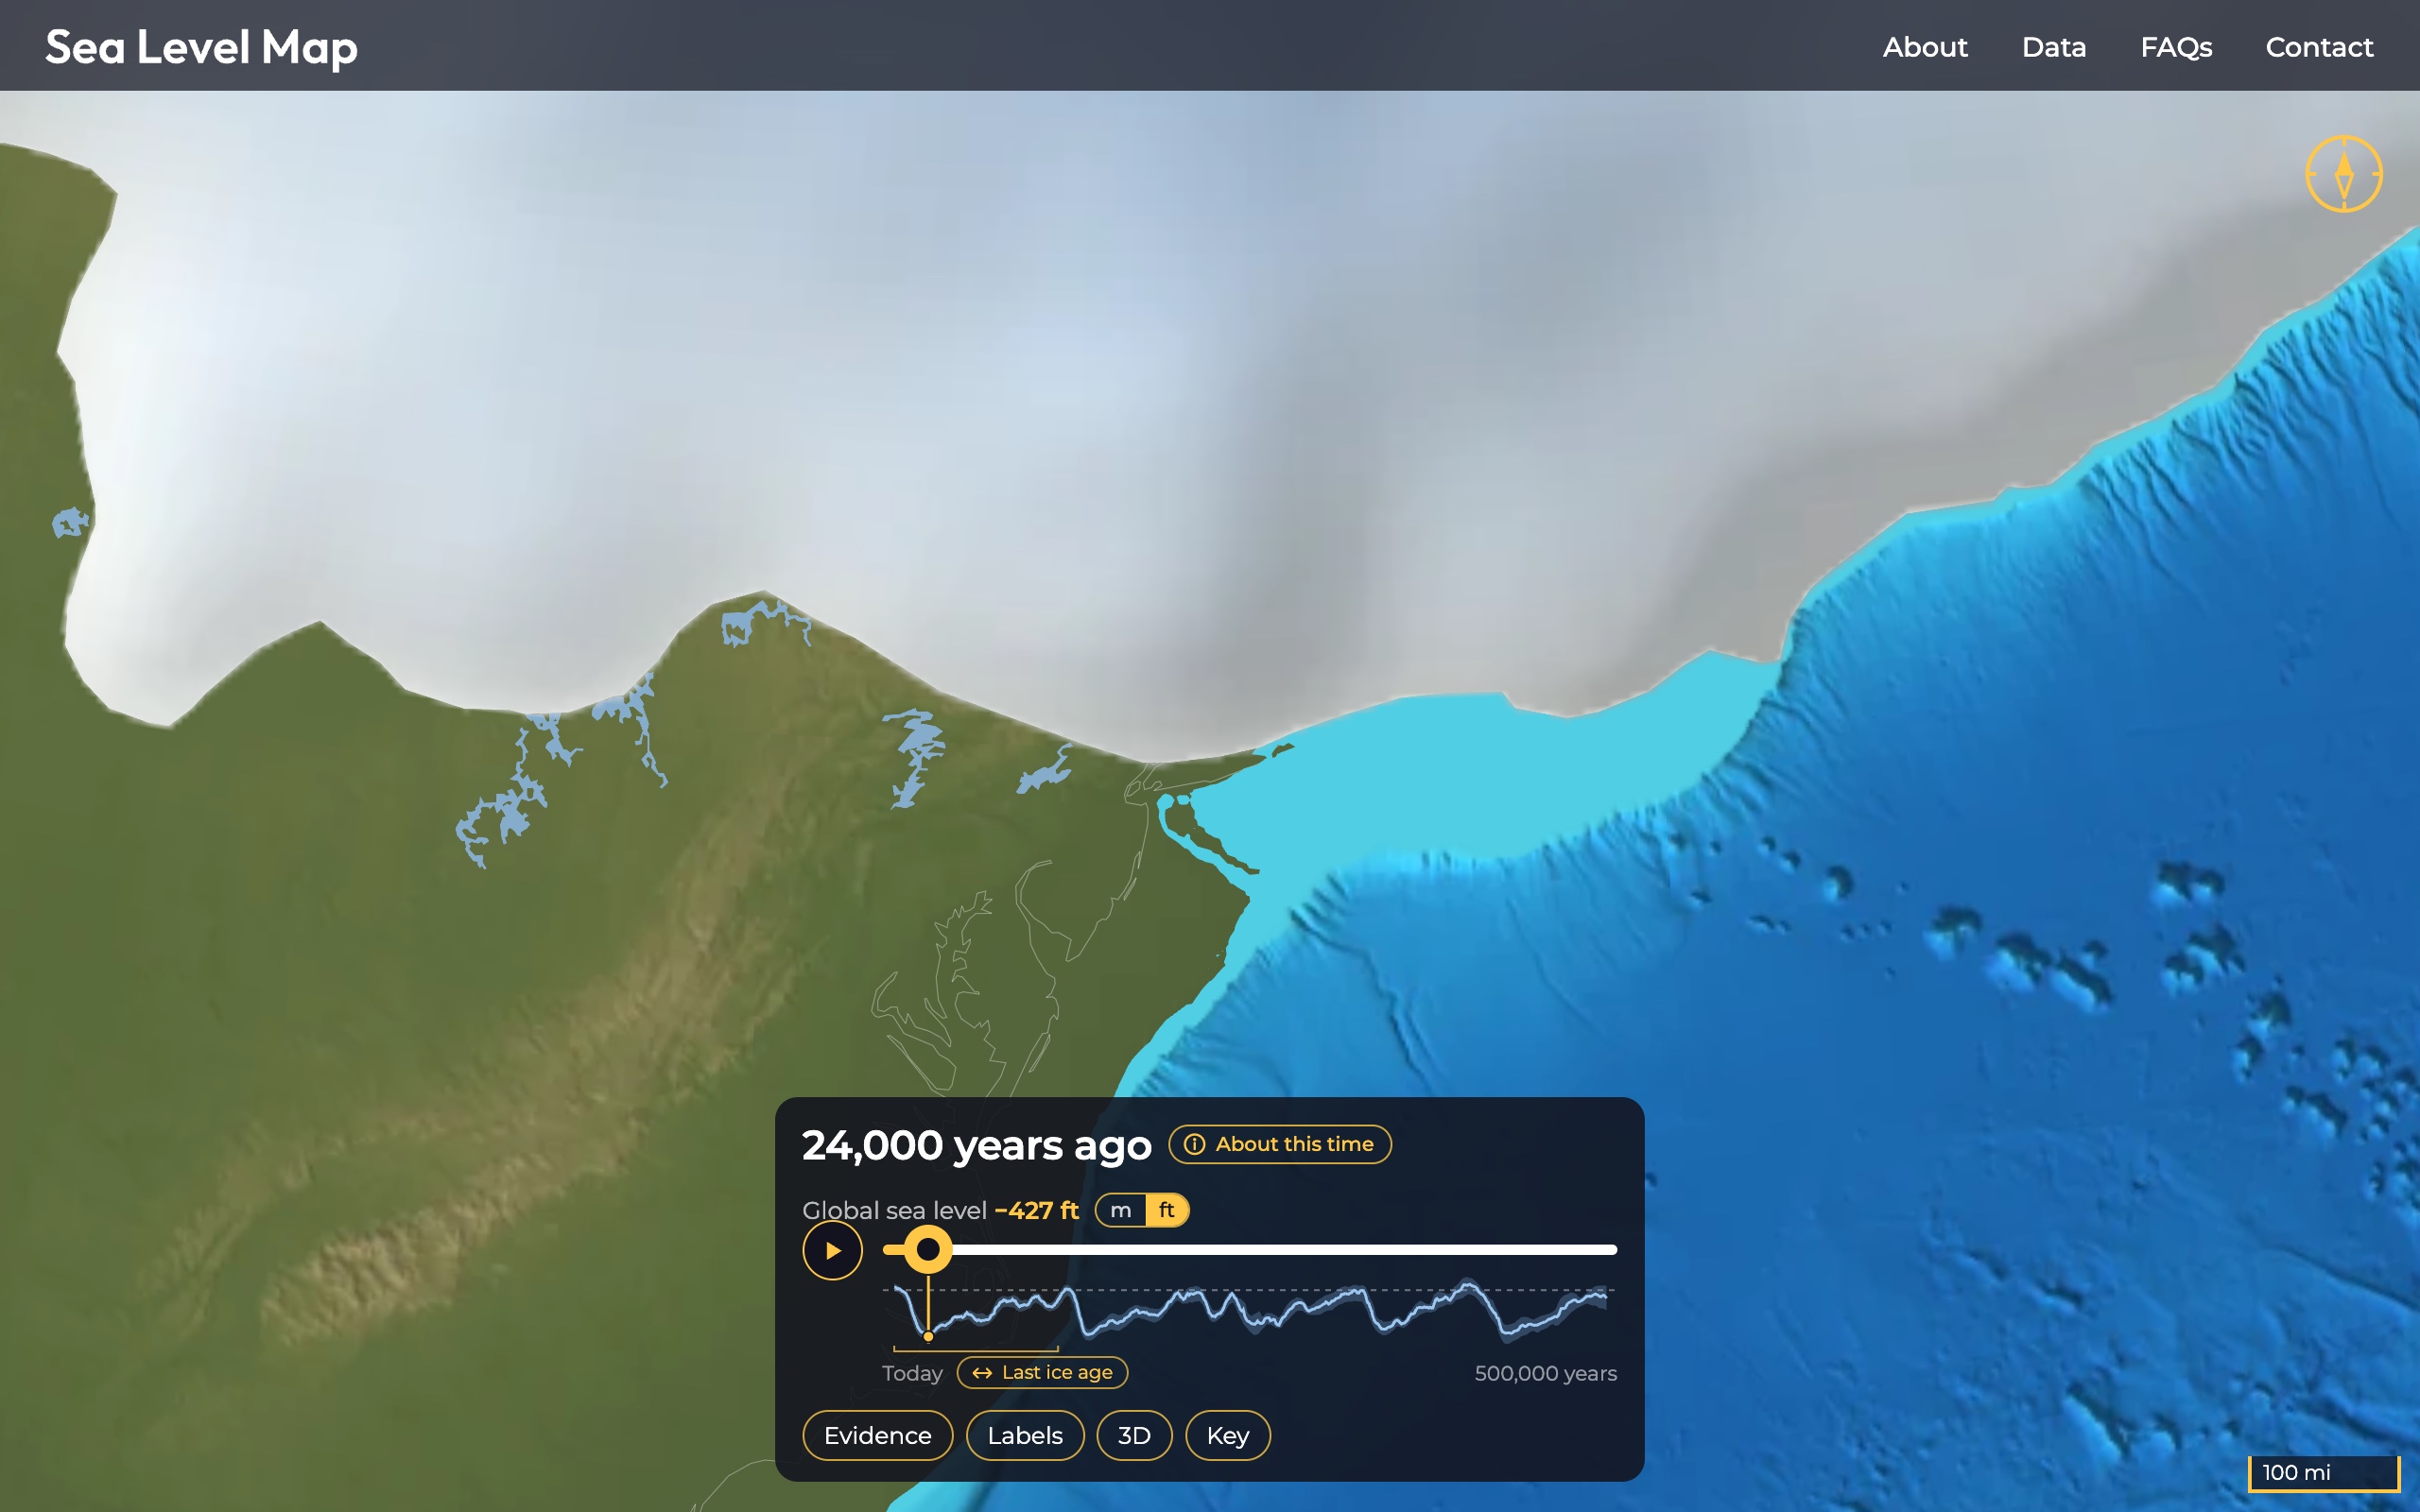
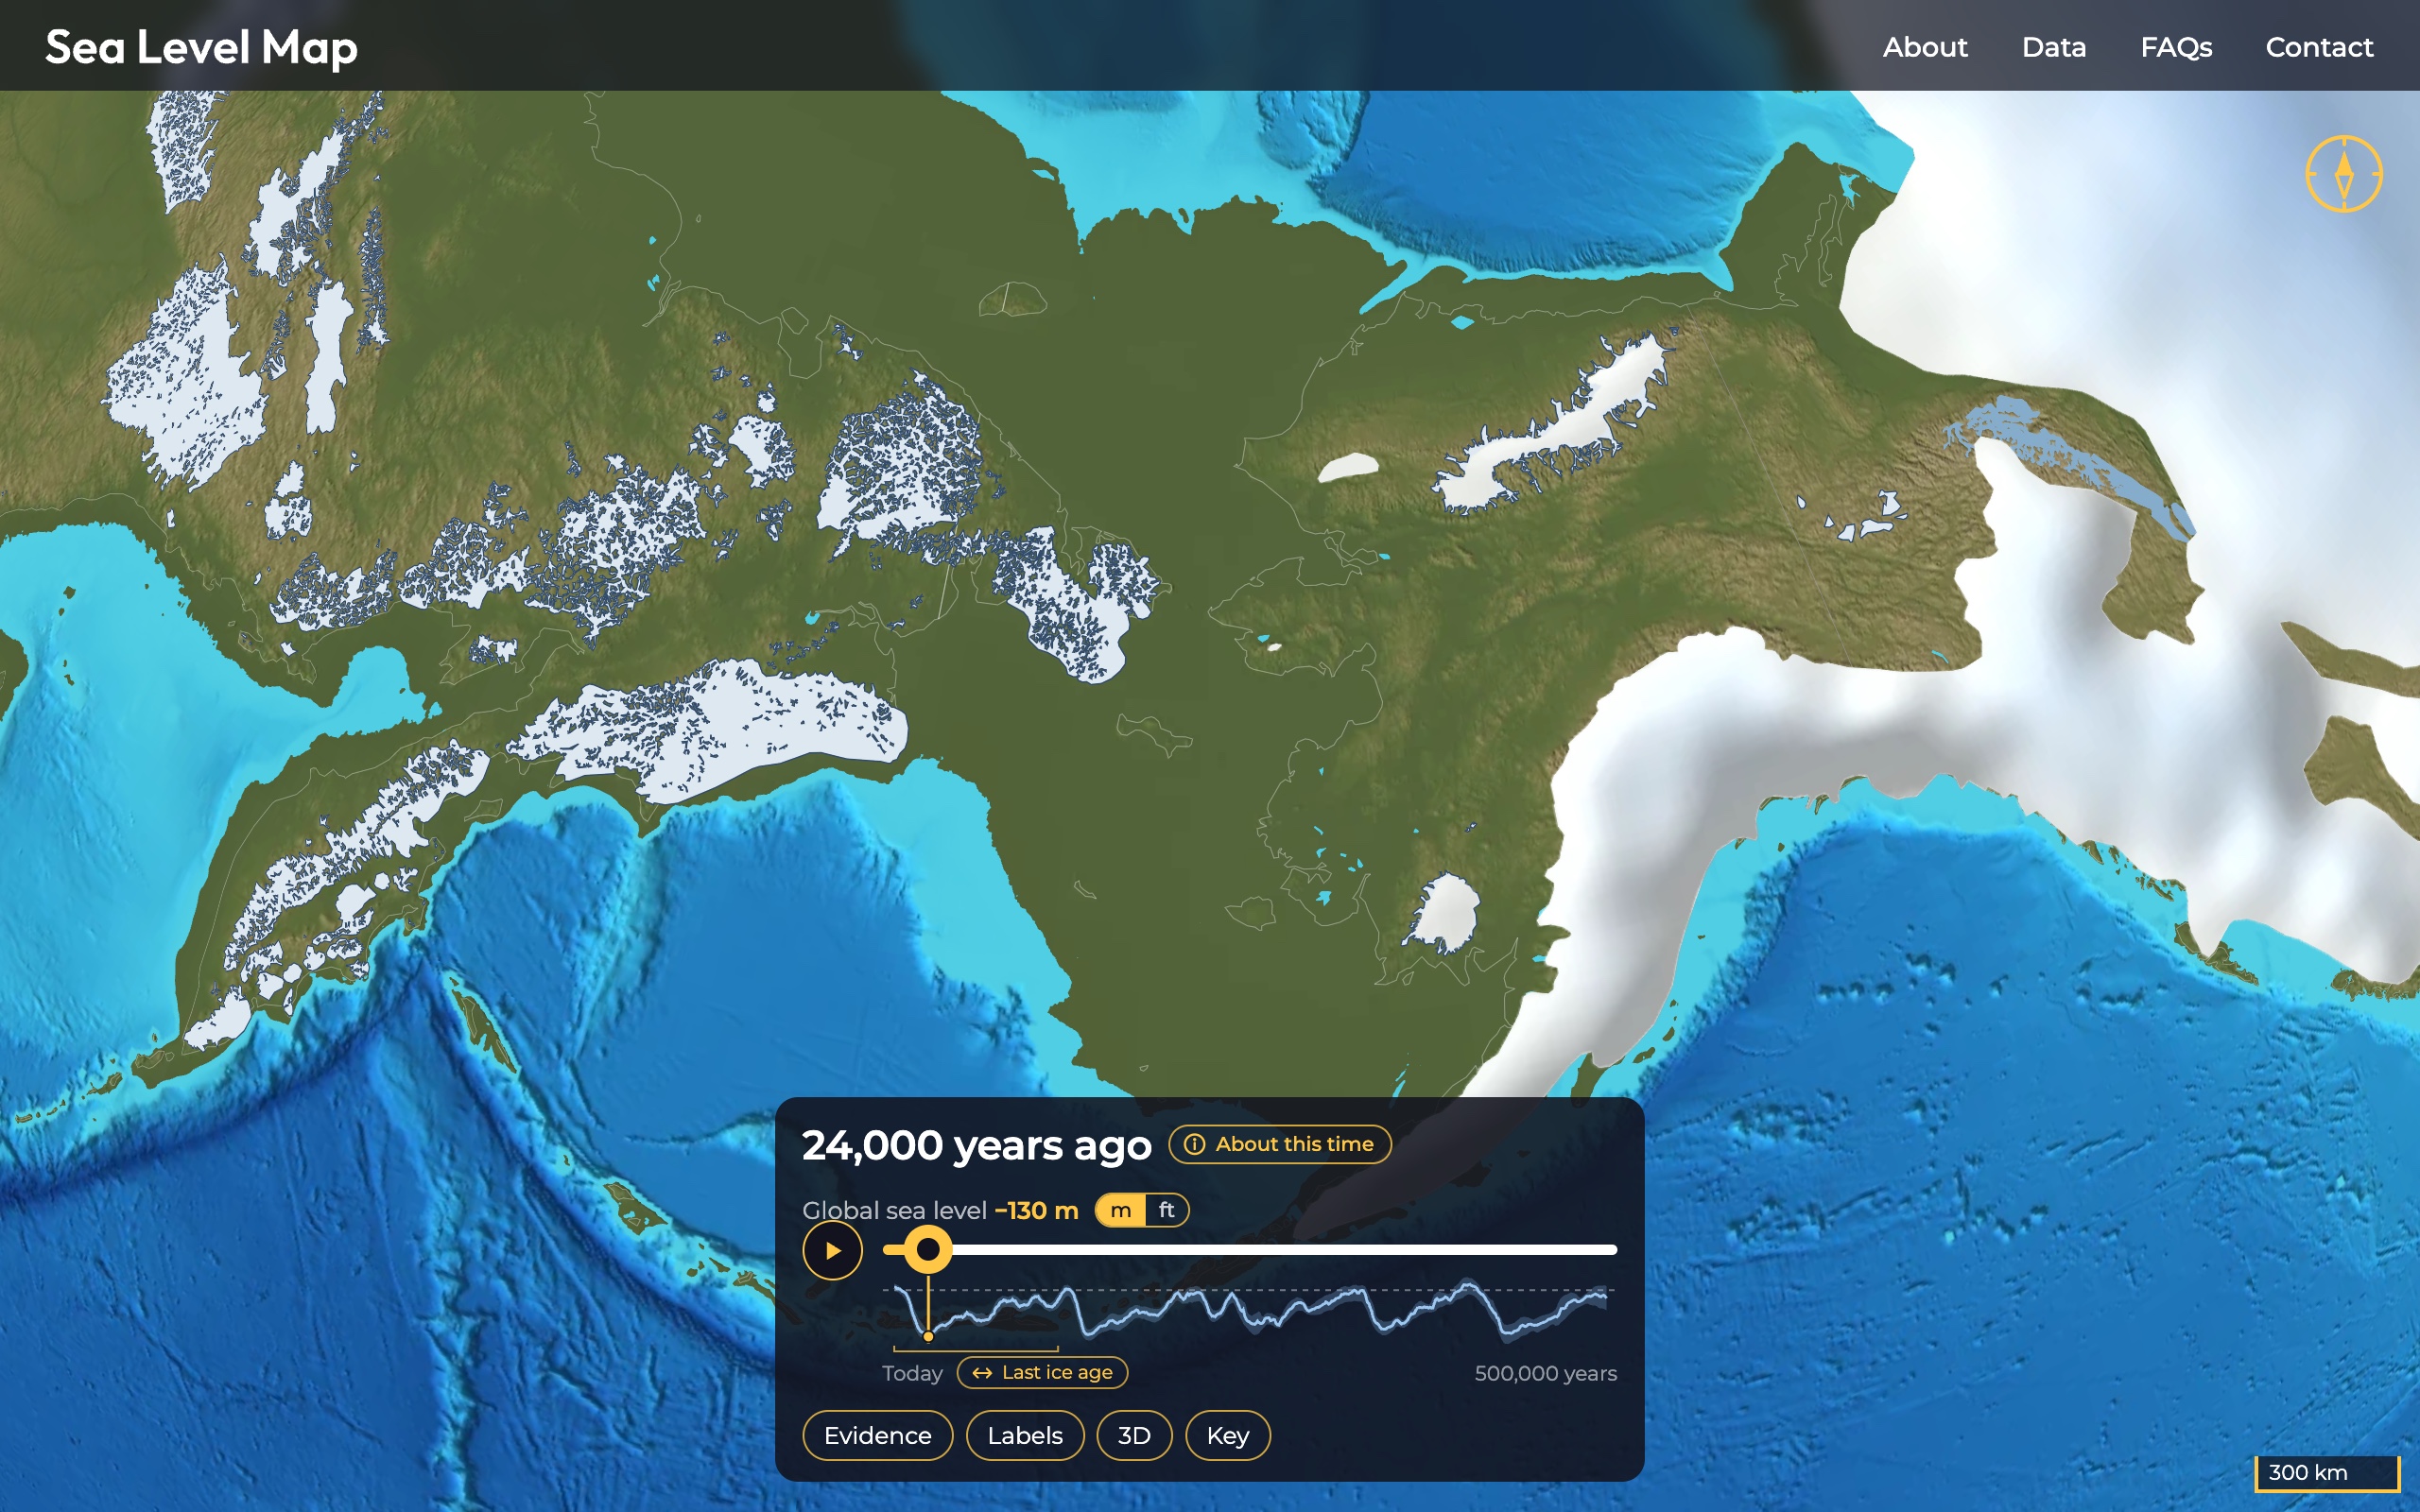
- Opens 24,000 years ago, near the Last Glacial Maximum, when ice reached south into Illinois, Indiana and Ohio and to Long Island, and the global sea stood about 130 m (427 ft) lower than today.
- The coastlines come from models of relative sea level that include the Earth's response to the ice, so near the ice sheets the land is shown pressed down by its weight.
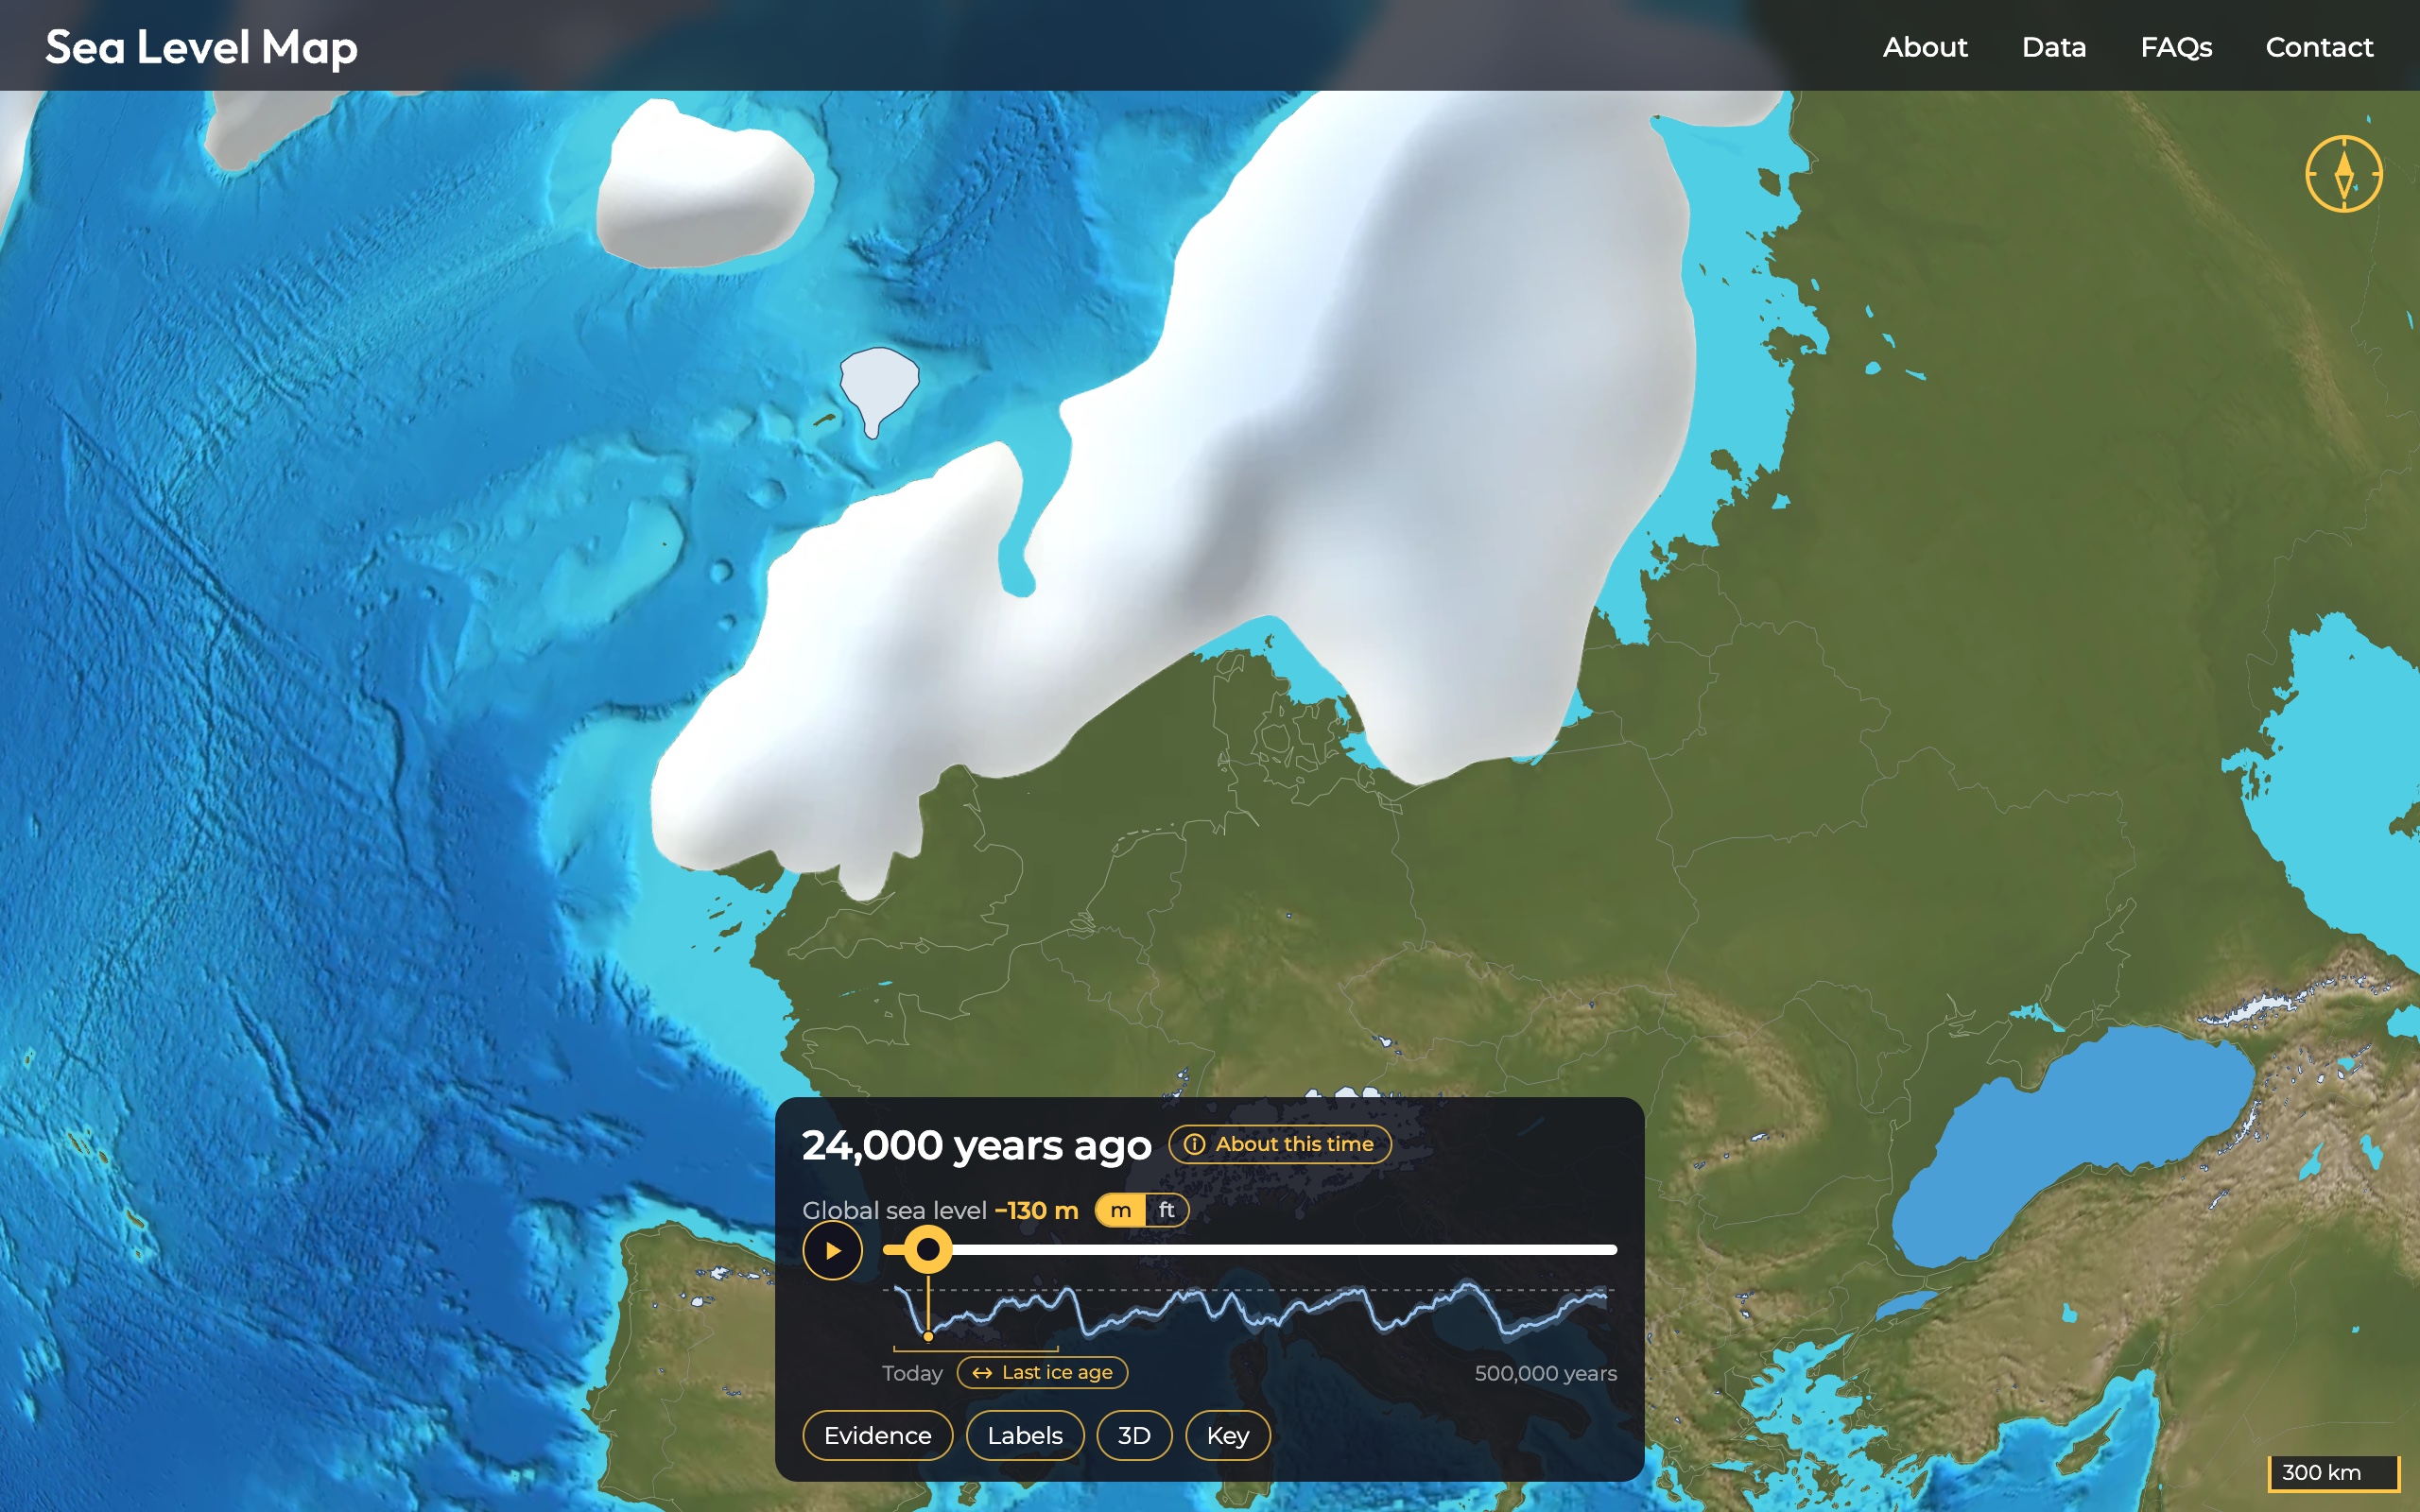
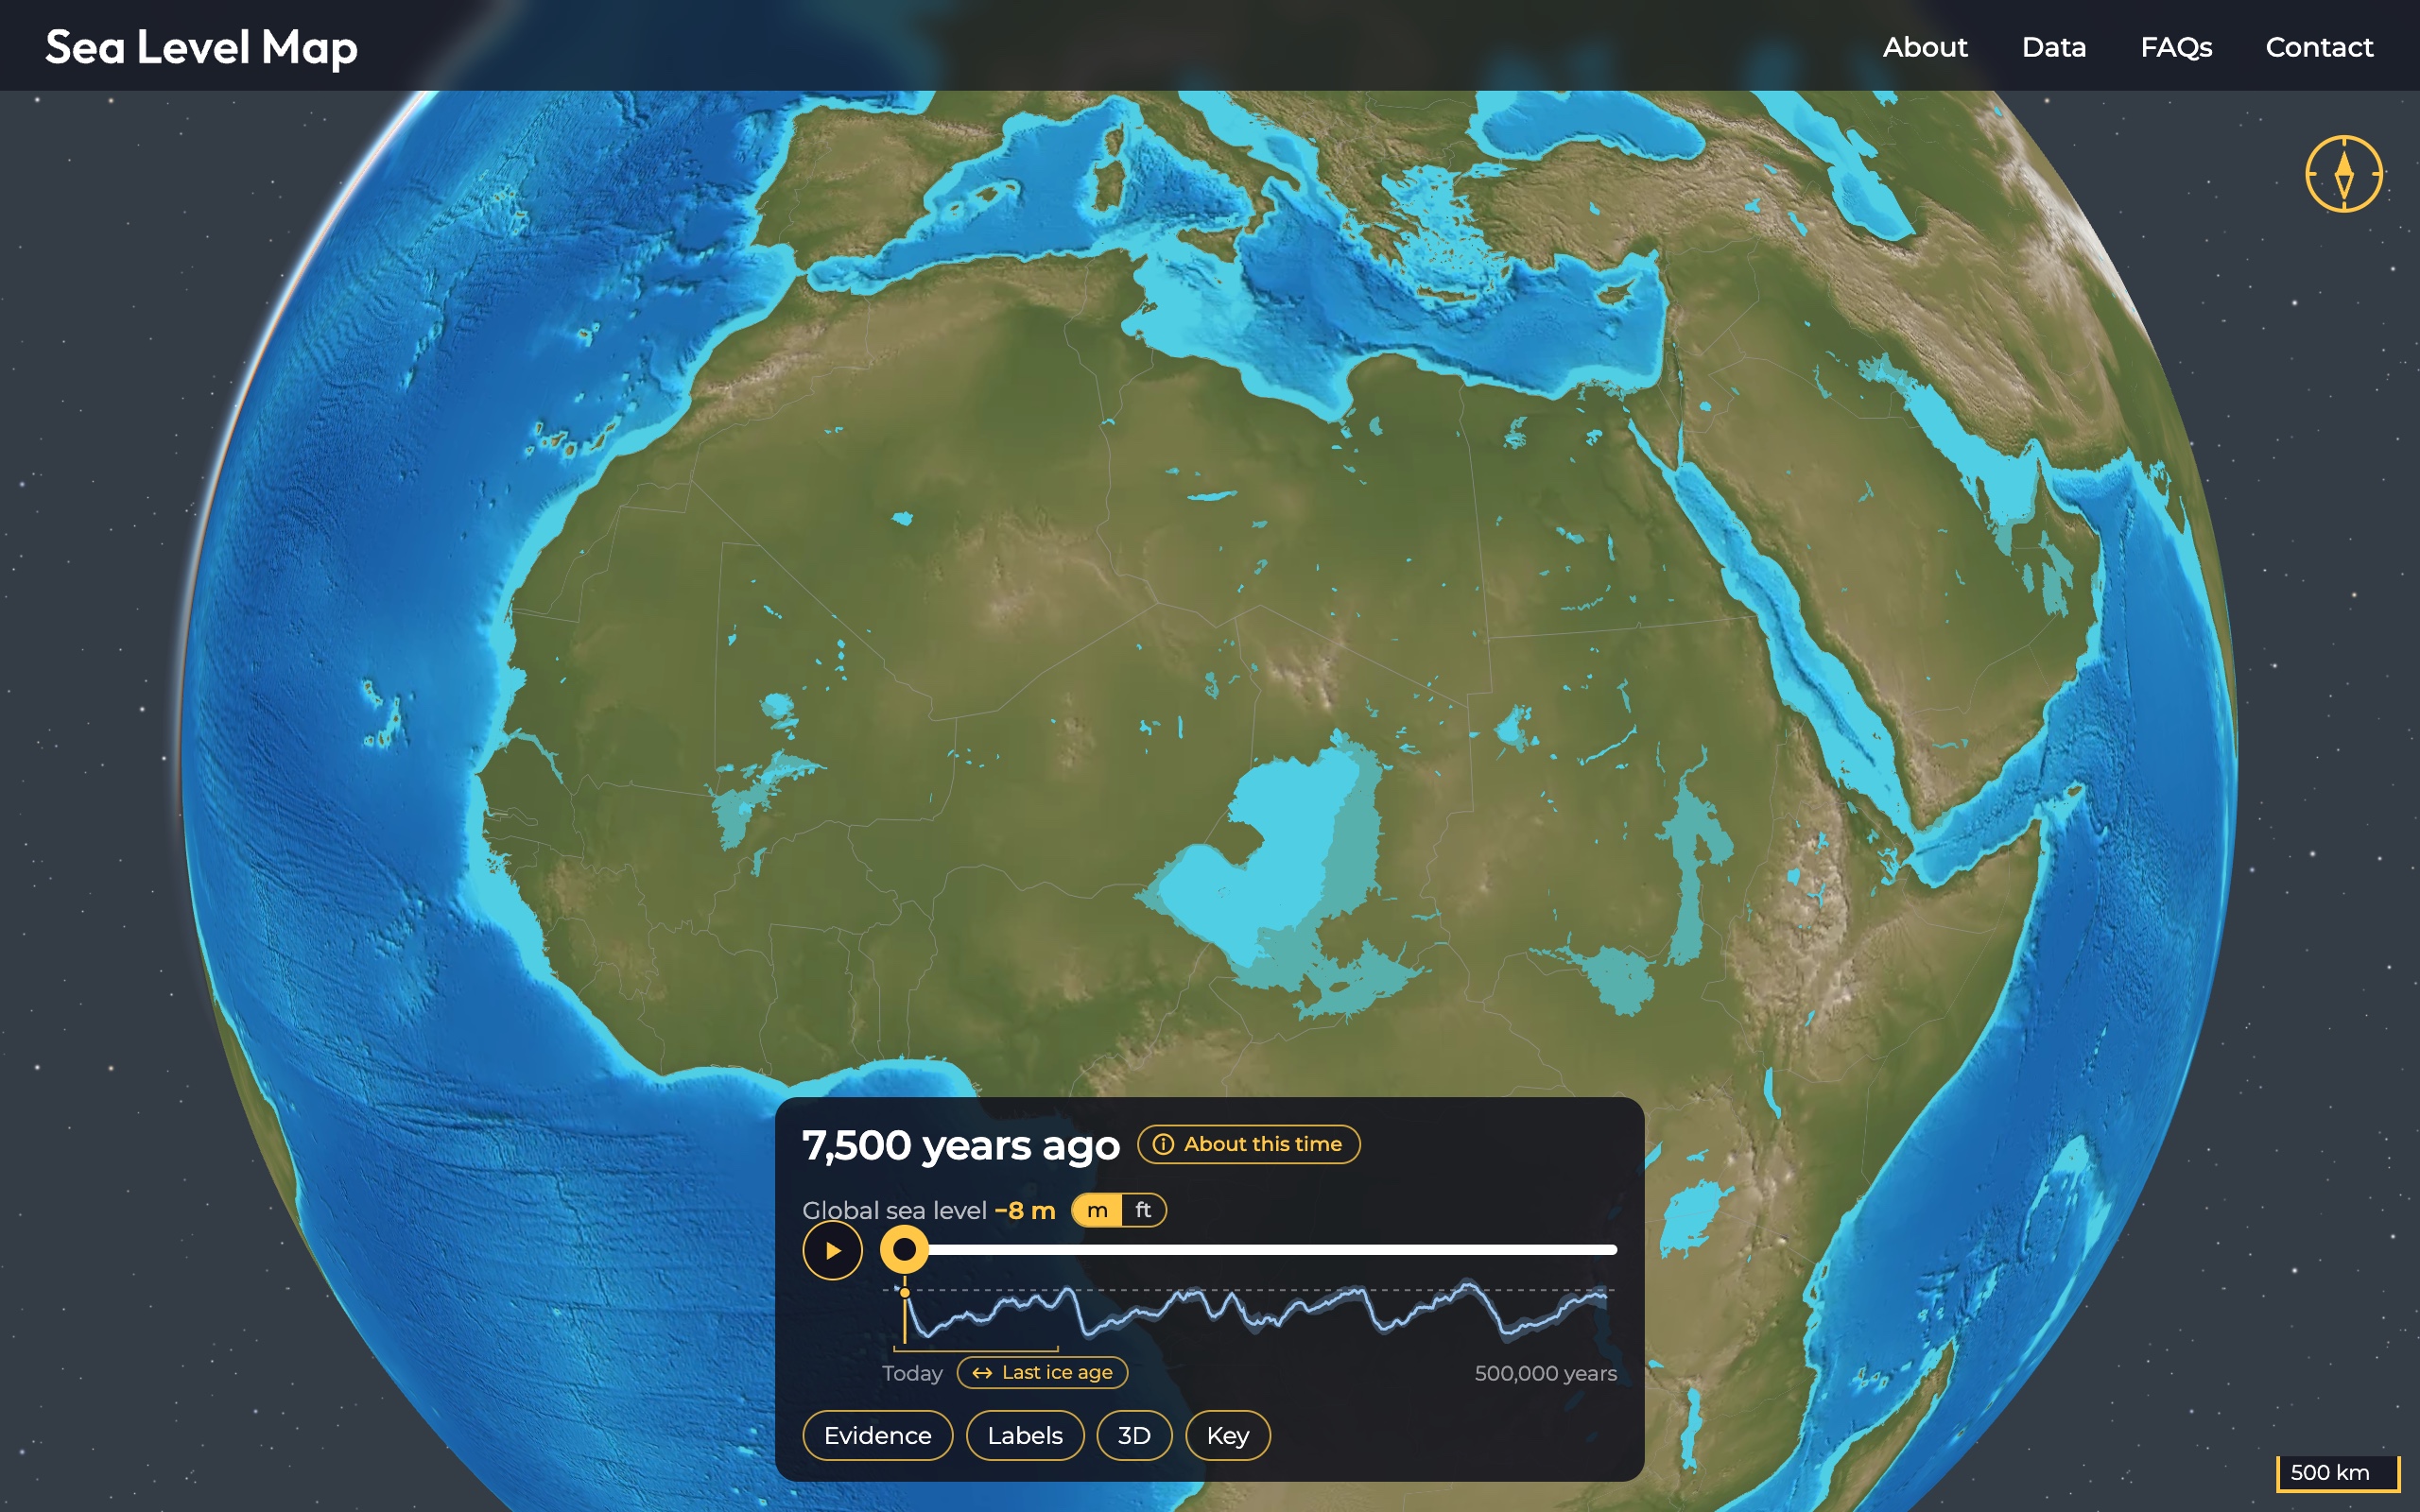
- Along with the ice sheets and coasts it shows mountain glaciers, proglacial lakes such as Lake Agassiz, the lakes of the Green Sahara, Lake Bonneville, and the Black Sea, Caspian and Baltic as they once were.
- Built with data and advice from sixteen scientists, credited on the Data page.
- Free, with no ads and no account. It sets no cookies and uses no analytics.
What you can do with it
Drag the slider to any time, or press play to watch the ice melt and the sea rise to the present. Zoom in anywhere: the distance scale in the lower right corner shows kilometers or miles, following the m and ft switch, and redraws as you zoom, so the size of a land bridge or the distance a coast has moved can be read straight off the map. The 3D button raises the relief, Evidence shows the dated records of past sea level the reconstructions are tested against, and About this time explains each step.
Any time can be linked to directly: sealevelmap.io/?ka=13 opens 13,000 years ago, and sealevelmap.io/?ka=0 opens today.
About
SeaLevelMap.io is a project of Other Waters Studio (Other Waters, LLC), a design studio in Philadelphia, and was made by David Clayton. It grew out of his research into how the ice ages reshaped the Earth's surface, and out of correspondence since 2022 with the scientists who shared their data. "I grew up near the shores of Lake Huron, and I have always been fascinated by the Great Lakes, particularly that they are only around 14,000 years old," Clayton said. The About page tells the rest, and explains how the map is made and what is measured and what is schematic.
Images
Screenshots of the map, free to use in coverage of SeaLevelMap.io with the credit "SeaLevelMap.io". The map is built from published data; its sources and their terms are on the Data page. Click an image for the full-size file.
Contact
David Clayton, contact[at]